Here is another note in our ongoing series of articles addressing China’s economic situation. Many times in the past, we have pointed out that official Chinese economic statistics can mislead analysts, and we suspect that we’re about to see a manifestation of that problem. Here’s why.
At the beginning of last year, foreign analysts watching official statistics saw growth rates in a variety of key areas falling off a cliff — showing almost apocalyptic contraction in industrial sales, profits, capital expenditures, and other areas. They duly reported that contracting data showed China on the cusp of a deep recession.
But here is the problem, as described for us by the inimitable Jonathan Anderson of Emerging Advisors Group. Of course, any big, aggregate economic statistics such as these are calculated using a methodology — what to include, what to exclude, how to arrive at the totals. China’s big agencies that report such statistics, such as the National Bureau of Statistics and the People’s Bank of China, often revise their methodologies. But unlike most western statistical agencies, they very rarely go back and revise previously reported data to reflect the new methodology.
That means that unwary analysts, relying on the nominal, as-reported data, can see huge positive or negative swings, and assume those swings represent things that are really happening in the Chinese economy… rather than seeing them for the merely statistical artifacts that they are.
When looking at China’s big, aggregate economic and financial data, then, it is important for analysts to examine not just the nominal, absolute numbers, but the rate-of-change numbers that the Chinese agencies usually report alongside them — which do reflect changes in statistical methodology. Of course these are not perfectly reliable either, and where they can be checked by other, independent data (such as data reported by China’s trading partners), they should be. But they usually give a picture much closer to reality than the unrevised, nominal values.
In the chart below from early 2018, the yellow line, “implied growth,” shows what the nominal, as-reported numbers say about growth. The blue line shows the more accurate rate-of-change numbers.
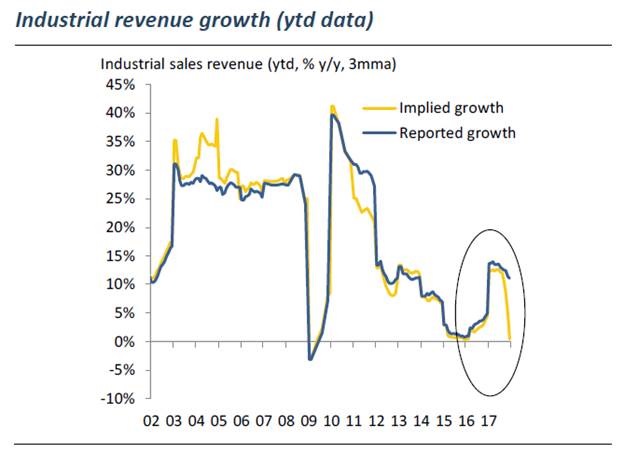
Source: Emerging Advisors Group
The rate-of-change numbers early last year showed a modest slowdown brewing, not an apocalypse. And very likely, twelve months later, another revision is going to show skyrocketing nominal values, and many foreign analysts will report that a massive stimulus has propelled China back into stratospheric growth… But this will also just be a statistical artifact!
The real picture that emerges from a more careful examination of the data, according to Anderson and other analysts we have found to be perceptive and reliable, is that China is indeed experiencing a slowdown; that fiscal and monetary policies have begun to relax, but that the next big stimulus has yet really to arrive; and that the policy easing shot-in-the-arm for credit and property values will probably come early this year, followed by an economic reacceleration later in 2019. In the meantime, the slowdown is still on.
Investment implications: Chinese economic activity and growth will likely accelerate in the second half of 2019, powered by fiscal and monetary stimulus that boosts credit and property. World GDP growth is likely to slow through 2019, and very slow global growth, or a recession, is possible in 2020.