Since the initial supernova of Federal Reserve and Treasury pandemic support for financial markets occurred last April, we have argued that this description-beggaring liquidity explosion was the single most important phenomenon for market participants to see and understand. Correct views and analysis of economic recovery trends and market theme and sector rotations have been important, but merely secondary to this overwhelming tide lifting most boats, if not all equally.
The Liquidity Peak Has Passed
Last week’s Fed meeting shone a light on the reality that this liquidity tsunami’s peak may already have passed. An understanding of this passing peak had already been percolating through markets as a rolling correction unfolded, challenging sector after sector as the broad U.S. index has chewed sideways during May and June. The truth is that the Fed’s “hawkish” tone (as “hawkish” as a tone could be said to be while massive central bank asset purchases are still ongoing) makes sense given the backdrop of rising inflation expectations and continued strong economic growth indicators in the U.S.
This was not a “taper tantrum” à la 2013; the market response was much more moderate, though of course, the communication was more mild than Ben Bernanke’s 2013 surprise, suggesting possible rate rises two years out — and merely indicating the beginning of discussions to slow the Fed’s $120 billion per month of asset purchases. (Bernanke’s comments in June, 2013 preceded the start of tapering by just six months.)
Even that two-year timeline is of course not a done deal; New York Fed president John Williams said in an interview shortly after the FOMC meeting that in the Fed’s view, the country remains far from the “substantial further [economic] progress” that would be needed to set the stage for an actual taper.
With all that said, however, there is an important sense in which the taper already began in the first quarter. The Fed may not be withdrawing liquidity from the system, but the rate at which liquidity is increasing (that is, the “second derivative” of liquidity growth) has declined sharply.
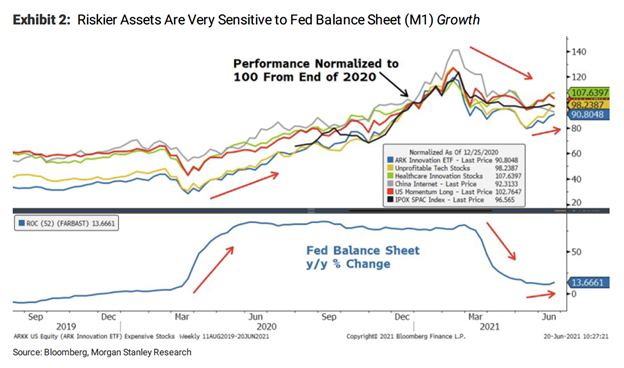
Growth In Money Supply Measures Is Slowing, and That Will Challenge Stocks
The bottom chart below shows the growth rate of the monetary base (M1); the top chart shows the appreciation of higher-risk/higher-growth/higher-multiple stocks during the same time period:
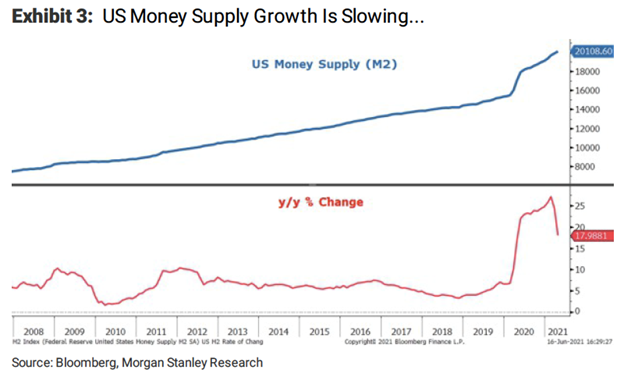
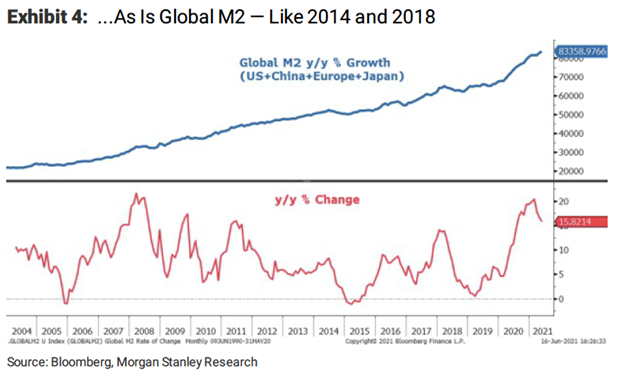
Also significant is the deceleration in the growth of the broader M2 money supply measure, both in the United States and globally. M2 growth has begun to decelerate, but remains sharply elevated compared to history. A difficult, volatile, or choppy period for markets is likely to prevail as M2 growth continues to slow to a level closer to its pre-pandemic norm.
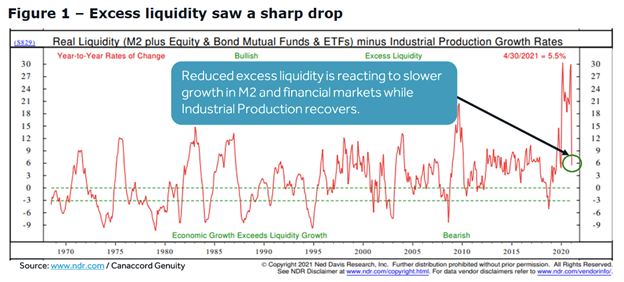
Further, as M2 declines, excess liquidity is increasingly taken up by efforts to ramp industrial production in response to the recovery of demand:
Rates of Improvement In Economic Data Will Slow
In April, we observed that many economic variables would be hitting year-over-year highs or lows as we lapped the initial pandemic shocks. The same analysis we applied above to money supply growth also applies to many economic variables: GDP growth, purchasing manager sentiment surveys, employment growth, consumer sentiment, earnings revisions, and the like. That is, while we believe they will continue to improve, the pace at which they are improving — the “second derivative” — will slow.
That slowing pace of improvement spells a challenge for the most recent rally beneficiaries, the cyclicals. Cyclical stocks tend to perform well relative to the market as a whole when the paceof data improvement is increasing, and correspondingly, they tend to underperform the market as a whole when that pace is decreasing, even if the data are still improving in absolute terms. This is the point at which market participants begin to price in the peak of improving data.
Investment implications: We think that with the passage of the liquidity peak, well before any explicit tapering occurs, markets are beginning to price in relative tightening, i.e., the deceleration of the growth of base and broad money and its availability to the financial system to bid up asset prices. The same effect will occur with economic data points which, while they continue to show sequential improvement, will see the pace of that improvement slowing. All in all, this environment will be less easy than that of the twelve months following the pandemic crash, and investors will have to be more selective and search for greater quality — that is, identifying companies with greater stability and growth of earnings and dividends — whatever their sector or theme of interest.