In keeping with our perpetual motto, that “earnings are the mother’s milk of stock prices,” we are listening to a lot of earnings calls and digesting a lot of companies’ commentary about their current environment and their anticipation of future developments. We are also looking more broadly at market- and sector-level earnings performance and forecasts. With the U.S. economy in a technical recession, and Europe in particular facing stiff economic, financial, and geopolitical headwinds, what do earnings and economic data have to tell us about the environment that’s emerging? What can we learn about what lies ahead in the rest of 2022? And most importantly for investors, how should we be thinking about the present rally — is it an all-clear, or a chance to position for another pullback and better opportunities later in the year? (Spoiler alert: No, it is not an all-clear; yes, we believe it to be a bear-market rally.)
How Earnings Looks On a Market Level — Energy Is Holding Up the Sky
Year-over-year, as of last week, the S&P 500 was showing a 9.4% earnings rise. Take out inflation and it is still modestly positive. The problem is that the market-level headline conceals sector-specific variances that paint performance in a different light. The energy sector alone is responsible for a 10.5% boost to the earnings of the S&P 500 as a whole. If you strip out the impact of energy earnings, and also the recovery of the hardest-hit pandemic sectors, overall nominal earnings fall to about -3.1% — with real earnings, of course, considerably lower.
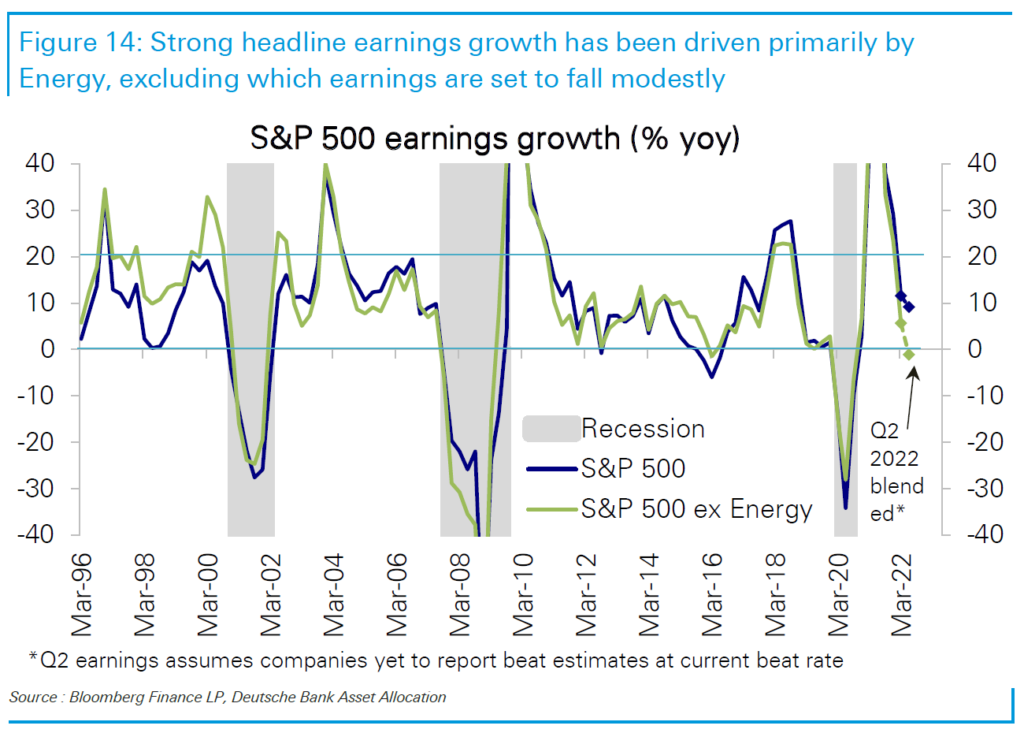
Source: Deutsche Bank Research
Sequential earnings, i.e., quarter-over-quarter rather than year-over-year, when seasonally adjusted, are set to fall by 4.5% nominally — one of the steepest declines in the past decade and rivalling the decline seen in the early days of the covid pandemic. The second quarter is typically strong — between 2011 and 2019, the second quarter saw a median 4.4% sequential growth — so this decline is a genuine indication of weakness.
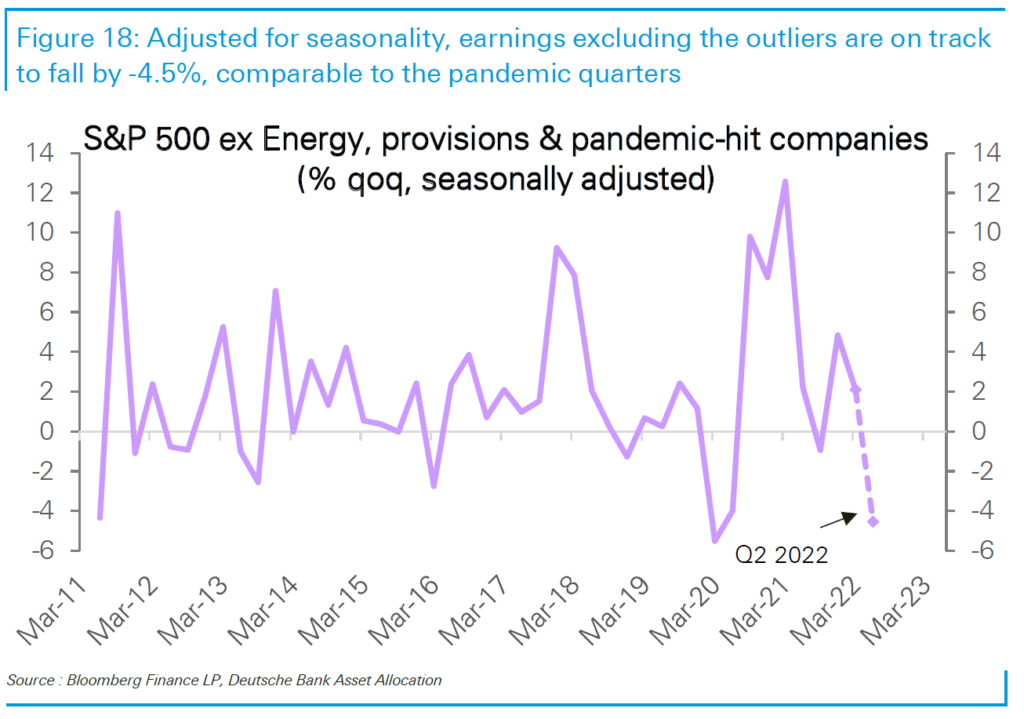
Source: Deutsche Bank Research
Notably, this is deeper than the “earnings recession” of 2015, which created a very challenging period for U.S. stocks. We discussed this period earlier this year in our investor conference call, pointing out that the S&P 500 had trouble making progress when S&P earnings stopped growing in late 2014 and declined into 2016. In the chart below, the brown line tracks the S&P 500, and the blue line represents S&P earnings per share. We also note that one of the culprits restricting US corporate profit growth then, is with us now in 2022: a strong U.S. dollar.
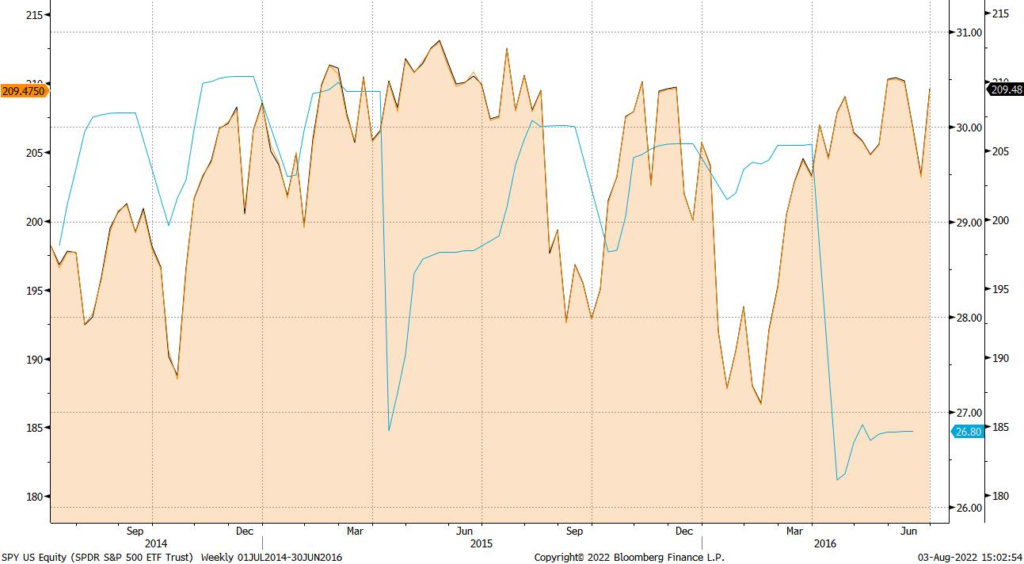
Source: Bloomberg, LLP
Tech Is Not Leading
Notably, while energy earnings are buoying the index-level results, the leaders of the pandemic period — the so-called “mega-cap growth” tech stocks, are having a harder time, with sequential earnings down over 5%. That is still just “catching down” to the long-term trend, but it is indicative that they may not emerge as the clear leaders from the current bear market, however long it lasts.
Further, NASDAQ 100 earnings have been lagging S&P 500 earnings since September, and that trend has accelerated.
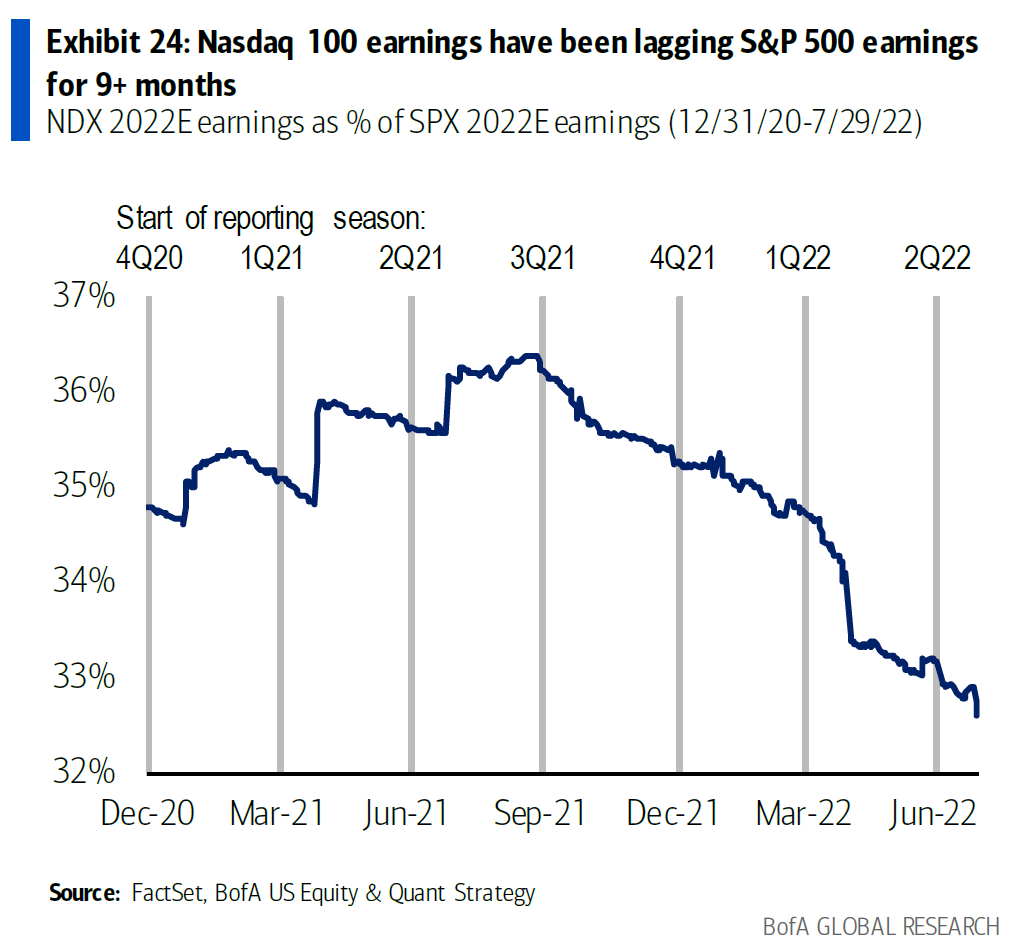
Source: Bank of American Global Research
As for the revenue line, topline growth excluding energy has declined to a nominal 4.5% (real, of course, much less). Sequentially, nominal earnings excluding energy are flat — again, in a quarter that is usually seasonally strong.
Margins tell the same story again — index-wide margins are holding up simply because of energy, but if you strip that out, margins are declining sequentially and are well below the record high set in the first quarter of 2021.
Earnings definitely confirm the other high-frequency economic data indicating that a slowdown is underway — whether you want to hold to the technical definition of a recession (two consecutive quarters of negative GDP growth) or not. (We do, since analysis becomes a bit meaningless if technical definitions change with the way the wind blows.)
Looking Forward, Earnings Estimates Need to Come Down More
In the leadup to second-quarter earnings, analyst forward estimates for third-quarter earnings were cut 3.6% excluding energy, and since earnings season got underway, have been cut another 2.8%. Estimates for full-year 2022 had come down 0.8% coming into earnings; they have fallen another 1.6% (again, excluding energy).
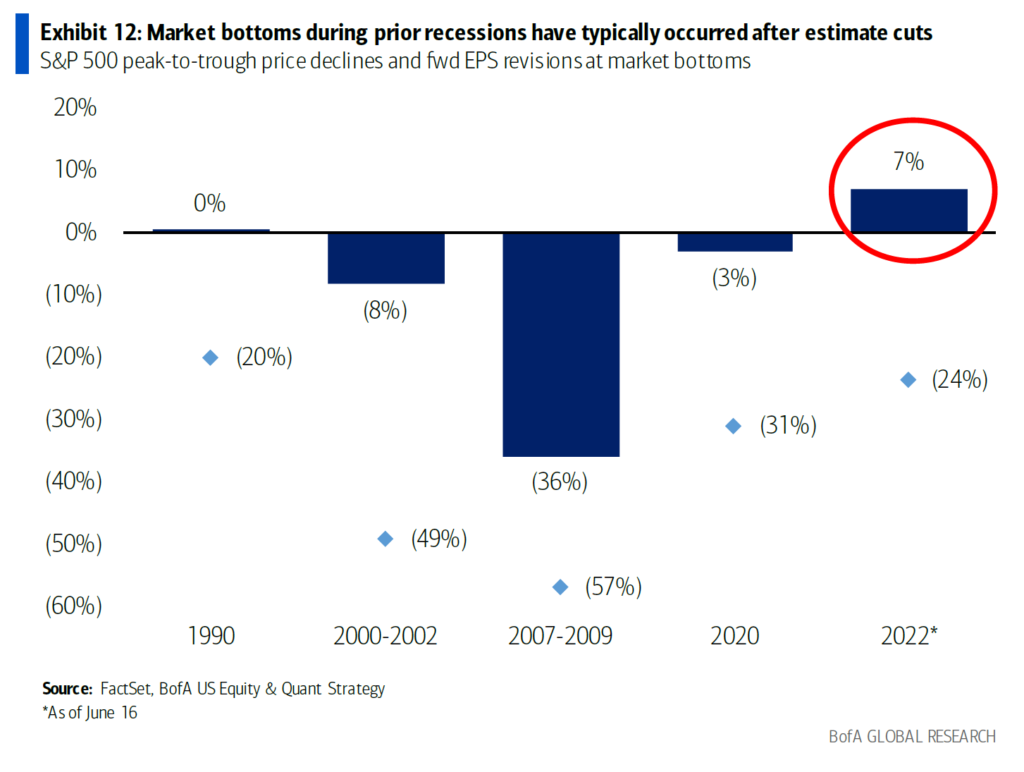
The trouble is that this isn’t enough: earnings estimates need to decline further to reflect the reality of economics, interest rates, contracting liquidity, and geopolitical stress. A look at the last few recessions shows that markets tend to bottom after estimate cuts reached a crescendo, and we are not there yet. Looking from the market’s January peak, forward estimates are still up 7% overall. Simply put, we need to see estimates of future earnings come down significantly before we believe that a market bottom is in.
Source: Bank of American Global Research
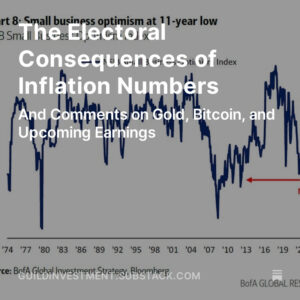
Corporate Pessimism and Consumer Stress
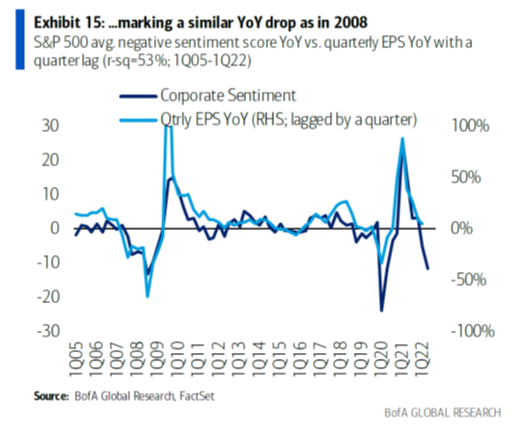
One AI linguistic analysis of call transcripts thus far shows a deterioration in corporate sentiment approaching that seen in early 2008. This tends to correlate with a decline in subsequent earnings.
Source: Bank of American Global Research
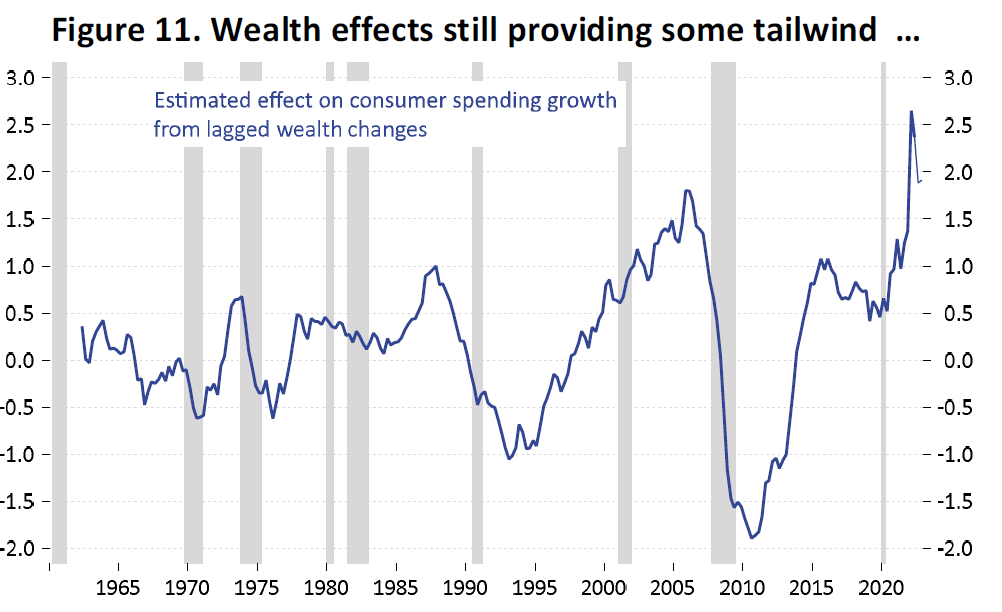
On the consumer front, the wealth effect is still being buoyed by home prices — which although they have decelerated, have not started to fall.
Source: Applied Global Macro Research
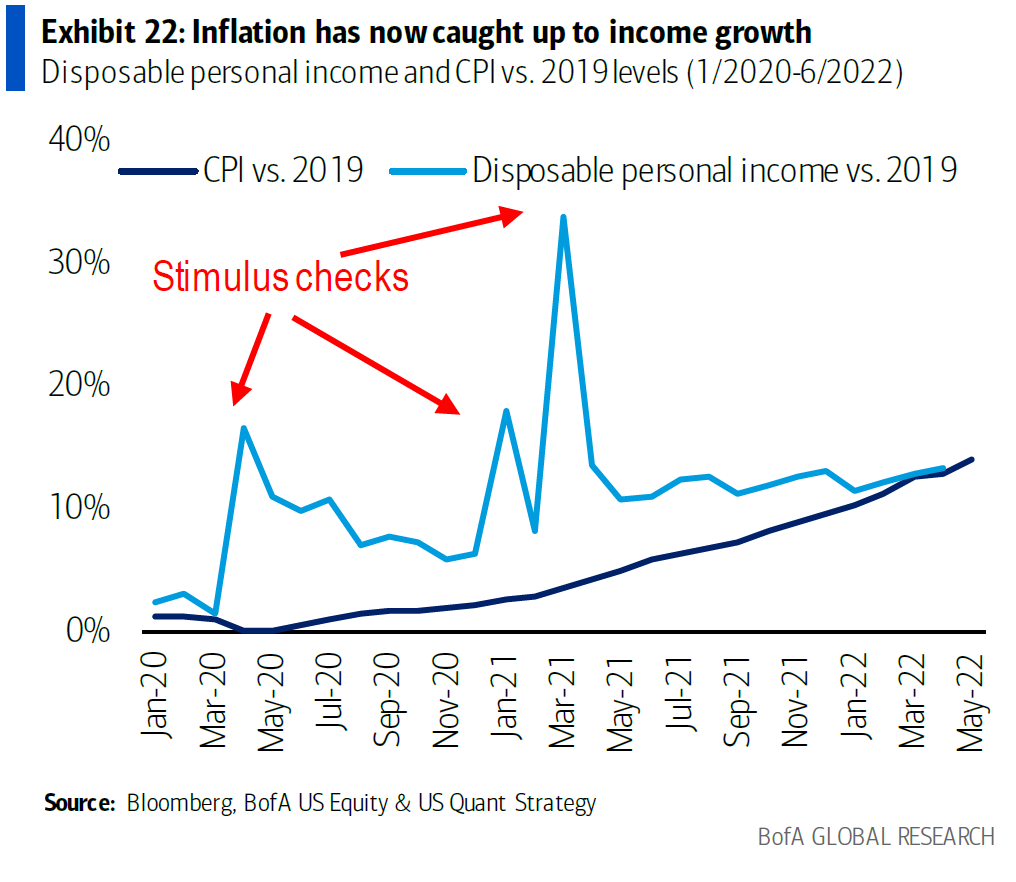
Still, the consumer high from the “stimmy” injections during the pandemic has dissipated… and disposable personal income has “caught down” to meet rising inflation. The consequence is that 40% of Americans told Census Bureau “Household Pulse” surveyers that they are finding it “somewhat” or “very” difficult to pay their bills.
Source: Bank of American Global Research
Capital Expenditures Are A Bright Spot…
Interestingly, in spite of corporate pessimism, capital expenditures are thus far holding up quite well, tracking at a 19% year-over-year pace, down only slightly from last quarter’s 20%. Notably, financials are showing some of the highest capex expenditures, certainly for software and other tech improvements. It may be that the pandemic and all its after-effects — particularly supply chain problems, wage inflation, and reshoring initiatives — are turning out to be particularly pro-capex phenomena. This capex strength is actually long-term bullish, particularly for the sectors where it is strongest, although some of these (such as materials and industrials) have long capex deficits to compensate for. Down the road, this capex will lead to productivity growth, so we hope that what we are seeing is the beginning of a real capex cycle, and not simply a flash-in-the-pan reaction to pandemic stresses.
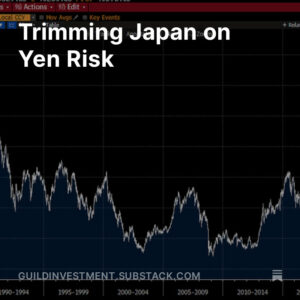
…And Perhaps the Dollar Is As Well
As mentioned above, the very strong U.S. dollar has been an undeniable headwind for U.S. corporates, probably reducing sales overall by about 2% year-over-year.
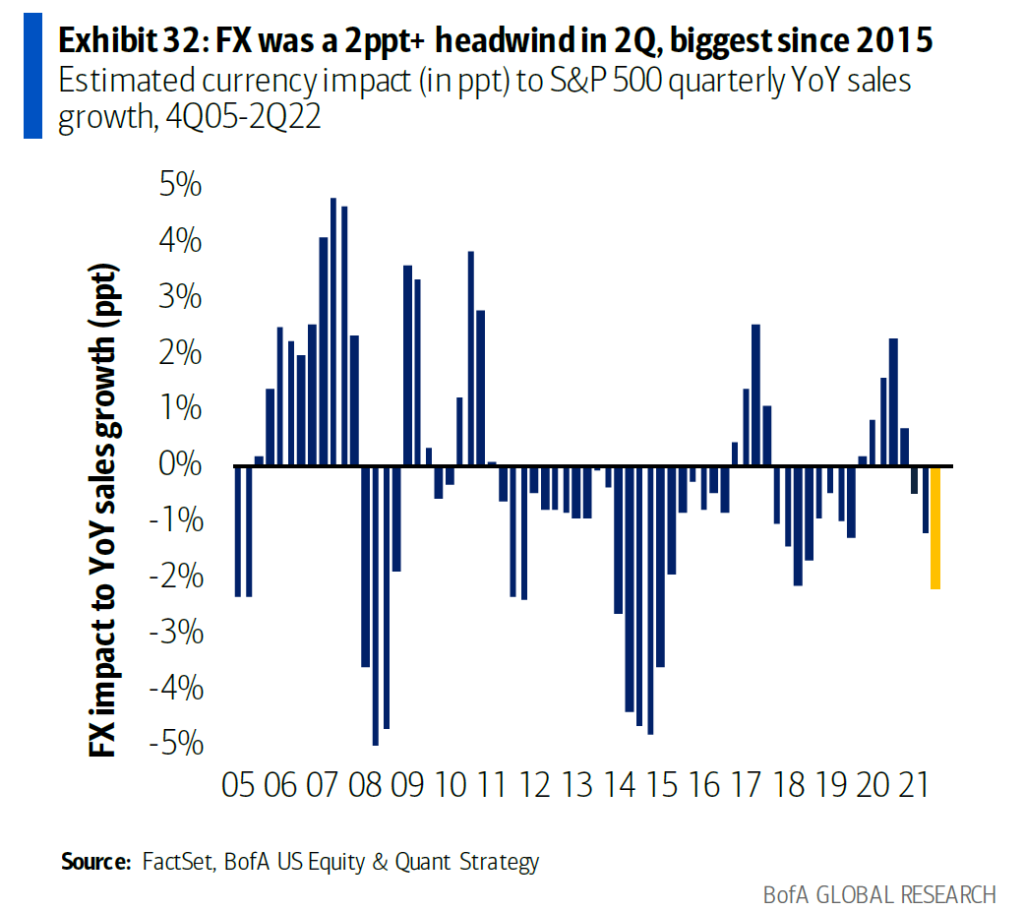
Source: Bank of American Global Research
The DXY dollar index has fallen back from a multi-decade high of 109.29. If that trend continues, it could become supportive of U.S. multinationals’ sales and earnings compared to the headwind they’ve endured during this episode of dollar strength. However, given Europe’s ongoing challenges, it’s probably too early to get bullish on the euro relative to the dollar.
Investment Implications: In spite of deteriorating data, July saw a strong rally — a bear-market rally, in our view — largely because sentiment and positioning had become so bearish in June. This rally has continued in spite of the looming headwinds of poor economic data, pressure from the Fed, and continuing inflation. In our view, the current rally could peter out soon, and we anticipate further stock market weakness later in the year as analysts finally begin to take their forward earnings estimates down to what will be their ultimate nadir. This is a good time to trim positions that have perhaps rallied beyond what the underlying economic and earnings fundamentals can support.